
The overview for on-brand graphics
You can create polished, on-brand infographics for your practice using Claude, with no design skills and no designer on retainer. Upload one or two images whose style you love, ask Claude to build a simple design system from them, then paste in your content and ask for an infographic. Because Claude builds it with code rather than painting a picture, every word is spelled correctly, your wording stays exactly as you wrote it, and edits take seconds. This guide gives you the exact prompts to create your first one this week.
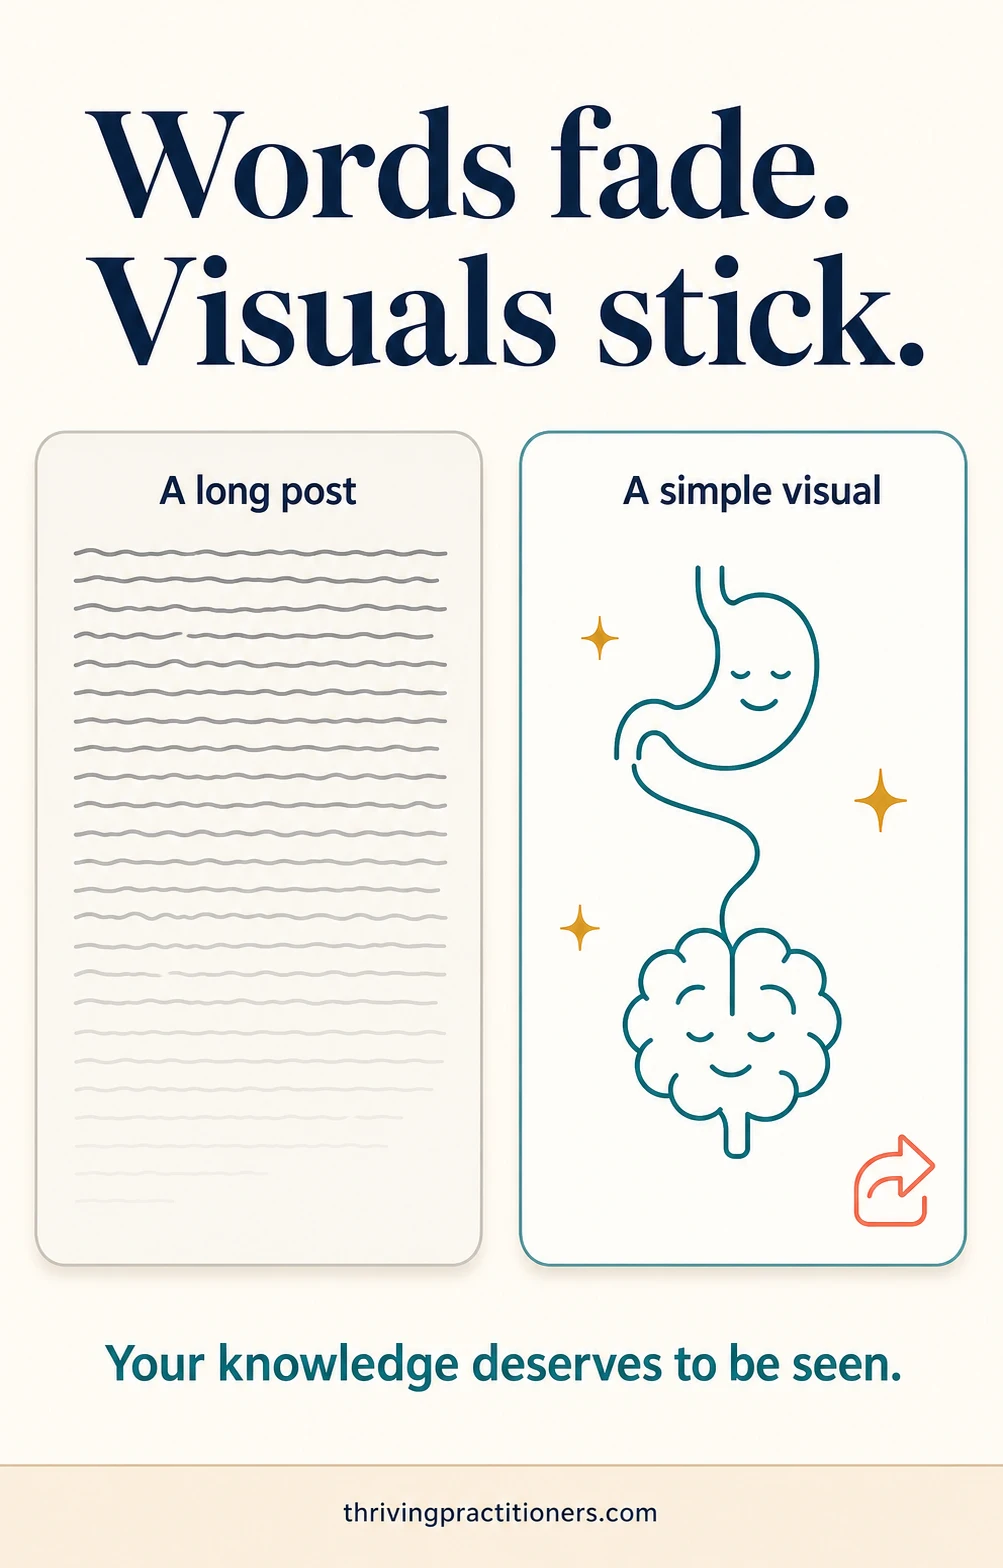
You spent an hour writing a thoughtful post about stress and the nervous system. It was accurate, warm and genuinely helpful. A handful of people saw it. Meanwhile, a colleague shared a simple visual explaining the same idea, and it was saved, shared and stuck to fridge doors. Sound familiar? Your knowledge is not the problem. The format is. People skim text, but they stop for a clear, beautiful visual, and your future clients are no different.
A quick credit before we start: this guide adapts a method shared by AI educator Ruben Hassid, who built one of LinkedIn’s largest audiences largely by pairing his ideas with simple, striking images.
His line stuck with me: “People forget what they read. They remember what they saw.” What follows is his approach, reworked for natural health practitioners.
Why do infographics work so well for natural health content?
Infographics turn complex health concepts into something a client can understand at a glance, remember for weeks and share with the people they care about. For practitioners, that means your knowledge travels much further than a wall of text ever could.
Natural health is naturally visual. The gut-brain connection, the phases of a herbal infusion, what actually happens in a first consultation, a seasonal wellness wheel: these ideas almost draw themselves. Yet most practitioners publish text, because making visuals used to mean hiring a designer, wrestling with Canva at 10 pm, or giving up.
That barrier has gone. What used to take a design brief, a week of back-and-forth and a few hundred dollars now takes a conversation.
JAMES’S PERSPECTIVE
“When I first discovered AI tools in 2022, I saw immediately how they could solve the biggest challenge facing practitioners: creating quality content consistently. But only if we use them to amplify our authentic voice, not replace it.”
James Burgin, former naturopath and digital marketing strategist
What is the easiest way to make an infographic with AI?
The easiest and most reliable way is to ask Claude to build your infographic as a small web page (HTML) rather than generating it as a picture. It sounds technical, but you never touch the code. You describe what you want in plain English, and Claude builds it, shows you a preview and edits it on request.
Here is the distinction that changes everything. AI image generators paint pictures. They can be gorgeous, but they routinely mangle text, misspell words and garble numbers, which is a real problem when your infographic is meant to educate.
Claude takes a different route: it writes the infographic as code, just as a website is built. Think of it as the difference between drawing a table freehand and using a spreadsheet. One is an approximation. The other is precise. Every heading, every step, every word appears exactly as you wrote it, which matters enormously when you are sharing health education and want your careful, compliant wording left untouched.
And edits are effortless. “Make the background cream.” “Swap step three for this.” “Make the headings bigger.” Each change takes seconds, and nothing else shifts. If you can write an email, you can do this.
How do you create your first infographic? Do this week
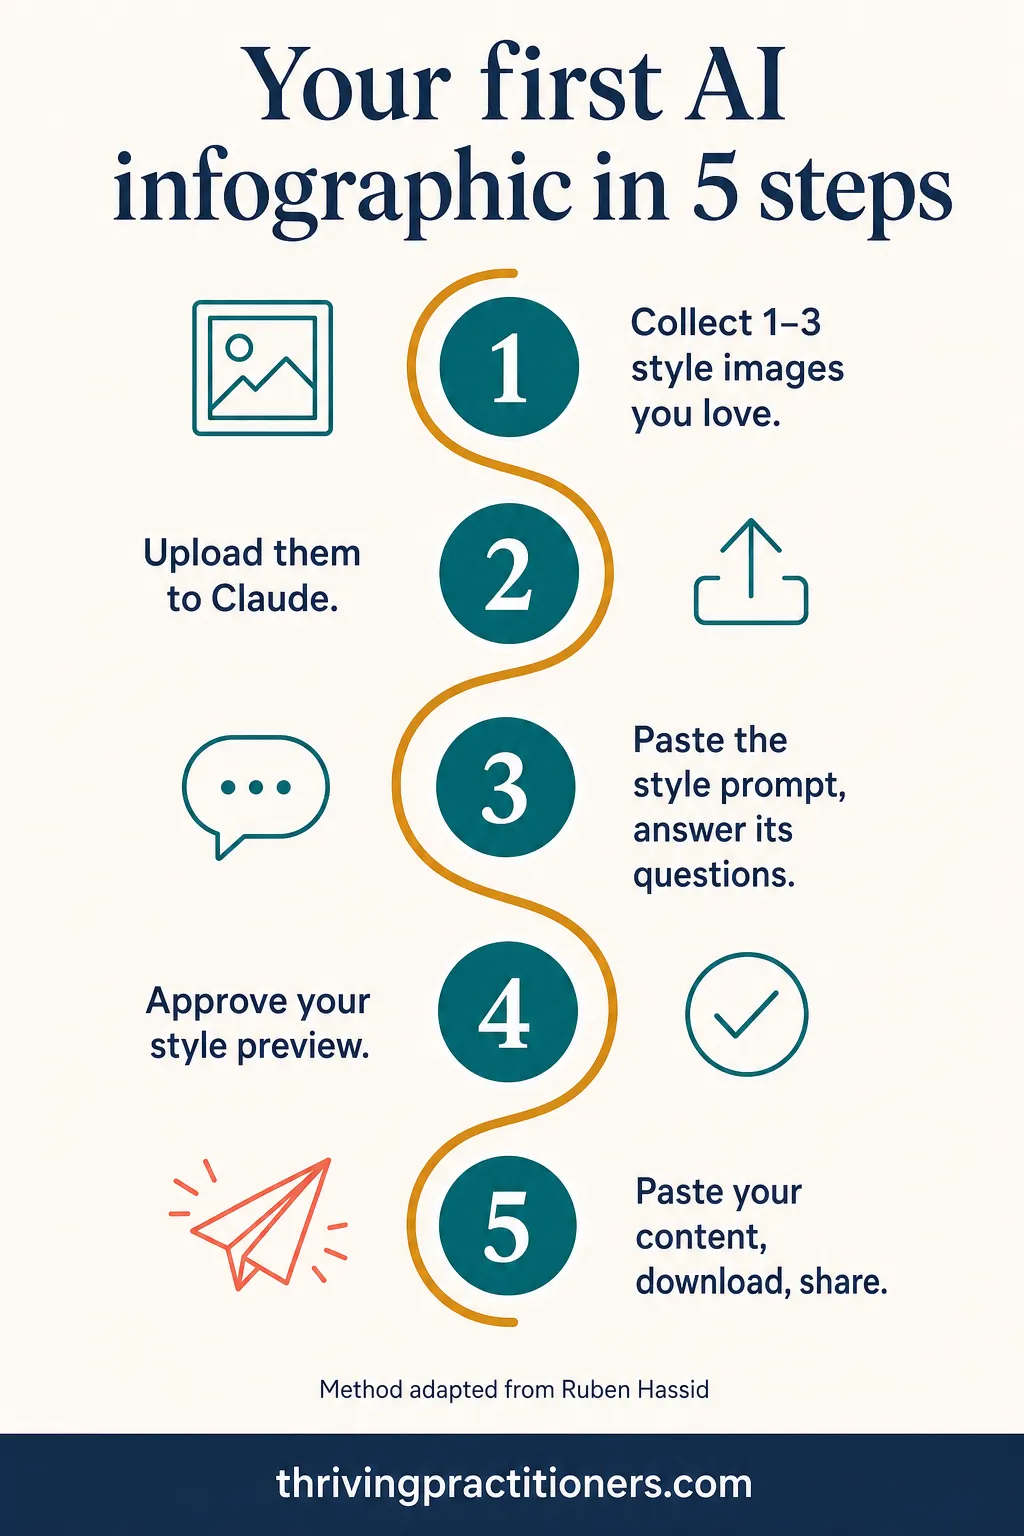
Gather one to three images whose style you love, ask Claude to turn them into a simple design system for your practice, approve the style preview, then paste in your content. Two prompts, both below, ready to copy.
- Collect your style references. Find one to three images whose look you love. Pinterest is brilliant for this: search one or two words like “wellness infographic” and follow the trail. Better still, take a screenshot of your website and logo, so Claude matches your existing brand.
- Open Claude and attach them. Start a new chat at claude.ai, click the plus button and upload your reference images.
- Paste the style prompt below. Claude will study your references, explain the style back to you in plain language and ask you a couple of simple questions. Answer them honestly; there are no wrong answers.
- Review the preview. Claude will show you a small style preview page. If something feels off, say so in ordinary words: “softer colours”, “less corporate”, “warmer”. Repeat until it feels like you.
- Paste the infographic prompt with your content. Then open the preview, download it, or take a screenshot, and share it.
PROMPT 1: YOUR STYLE (COPY AND PASTE)
You are my design lead. I am a natural health practitioner, not a designer, so talk to me in plain language.
I have attached images showing the look I want (and screenshots of my own website and logo). Study them and create a simple design system for my practice: 4 to 6 colours with their hex codes, easy to find fonts, and a short description of the overall feel.
Report back in under 150 words, no jargon. If a real decision is open, ask me a maximum of 3 simple questions with the trade-offs explained. Then build a one-page preview showing the colours, fonts and one example card, so I can approve the style before we make anything. Match my references faithfully rather than adding your own taste.
PROMPT 2: YOUR INFOGRAPHIC (COPY AND PASTE)
Using the design system we agreed on, build an HTML infographic titled “[YOUR TOPIC]”.
Here is the content to include: [PASTE YOUR POINTS, IN YOUR OWN WORDS].
Keep it uncluttered and easy to read on a phone. Size it as [a square for Instagram / a tall 4:5 for Instagram and Facebook / an A4 portrait for a printed clinic handout].
Keep all health information general and educational, with no treatment claims or promised outcomes. Use my exact wording for anything health-related. Show me a preview when done.
When you want changes, just talk to it: “Swap the background to cream, make the headings larger, and change step three to say this instead.” That is the entire skill.
KEEP LEARNING WITH THE COMMUNITY
If you would rather try this with company, our Growth Hub members workshop exactly this kind of AI project together: weekly Friday Q&A sessions, a full replay library, step-by-step Action Plans, interactive client education resources for your website, and a WhatsApp group where practitioners share what they are building. $49 per month, cancel any time.
What should you use infographics for in your practice?
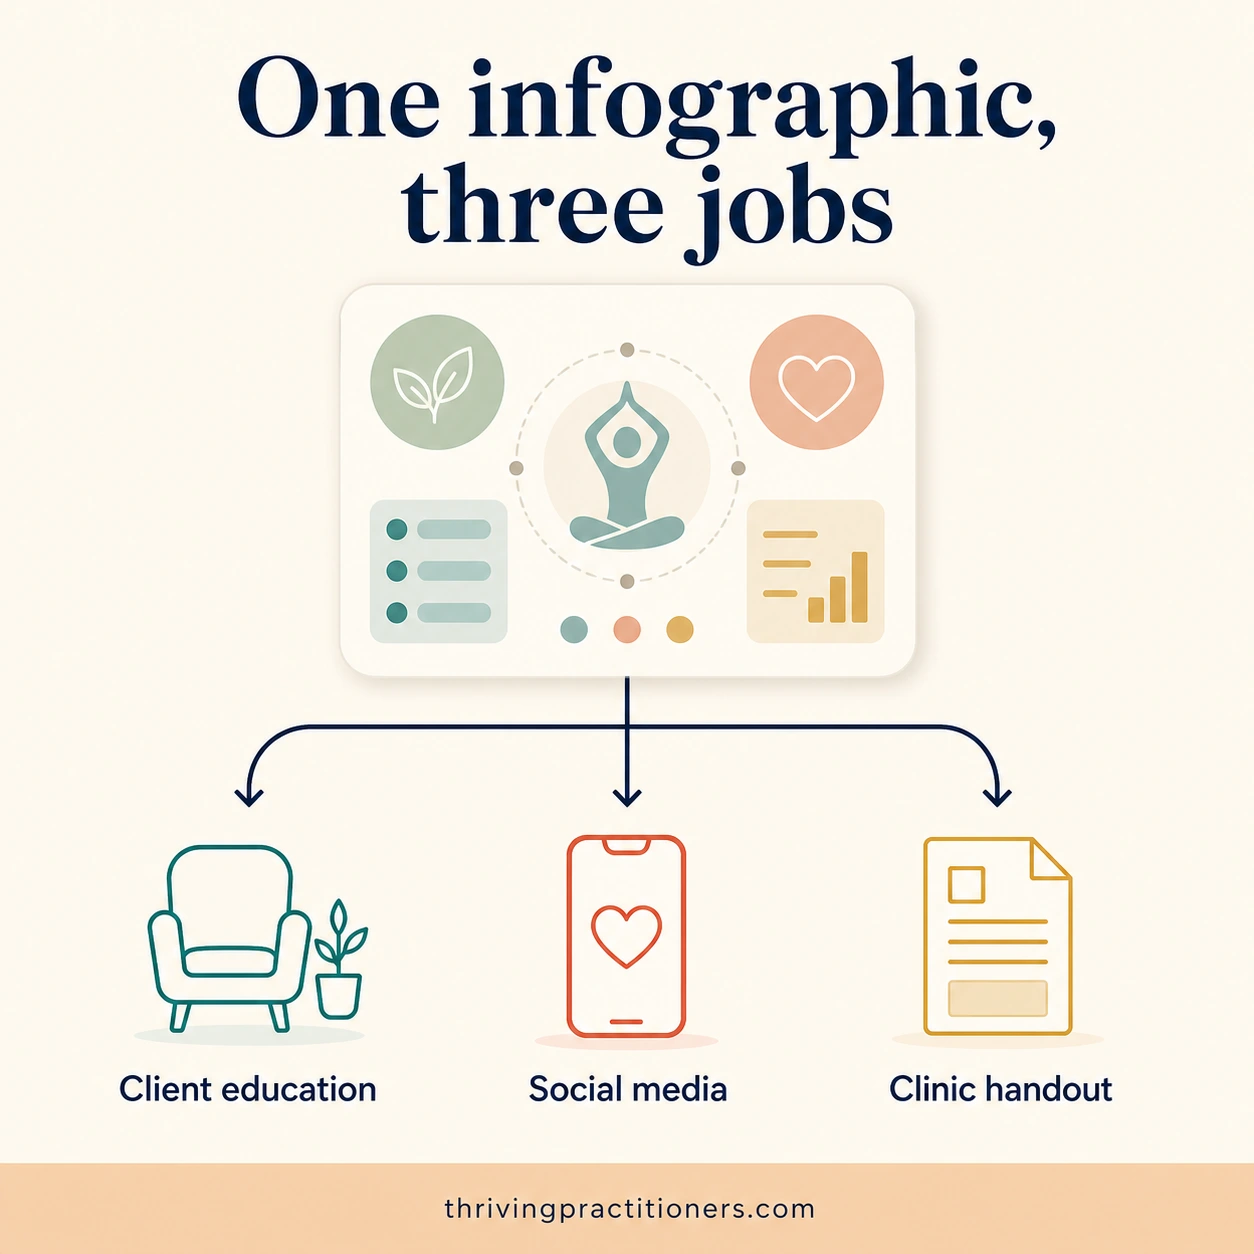
Start where visuals do the most work: educating clients, staying visible on social media, and professional printed materials in your clinic. One infographic can serve all three.
- Client education. Explain what happens in a first consultation, describe the gut-brain connection in plain language, or walk through how to prepare a herbal infusion. Educational visuals help clients feel informed and confident, and they describe rather than prescribe, which keeps you on safe ground with Australian advertising guidelines.
- Social media visibility. A weekly visual tip, a “what naturopaths actually do” explainer, or a seasonal wellness graphic gives people something worth saving and sharing. Visuals are how you stay in front of future clients without writing an essay every day.
- Practice materials. A welcome handout, a “preparing for your appointment” one-pager, or a professional overview to share with referring practitioners. Print quality, on brand, made in an afternoon.
JAMES’S PERSPECTIVE
“AI isn’t about replacing the human touch in healthcare. It’s about amplifying your authentic voice so more people can discover your healing gifts.”
James Burgin, Founder, Thriving Practitioners
Want to make this even faster?
Once you are happy with your style, there is a lovely next step: you can teach Claude your design system once, save it as a reusable “skill”, and from then on your prompts can be one line long: “Make me an infographic about sleep hygiene.” Same brand, every time. It takes about ten minutes to set up, and we will walk through it step by step in an upcoming article and inside the Growth Hub.
Frequently asked questions
Where can I get step-by-step help creating infographics for my practice?
Inside the Thriving Practitioners Growth Hub. Members bring projects exactly like this to our twice-a-month Friday Q&A sessions and build them with guidance, along with a replay library, Action Plans, and a supportive WhatsApp group of fellow practitioners. It is $49 per month, with the first month free, and can be cancelled at any time at https://thrivingpractitioners.com/growth-hub/
Do I need design skills or coding knowledge?
No. You never touch the code and you never open design software. You describe what you want in plain English, react to previews, and ask for changes the way you would brief a helpful colleague.
Which AI tool is best for practitioner infographics?
Usually Claude, because it builds infographics with code rather than generating them as pictures. That means accurate spelling, your exact health wording preserved, and easy edits. AI image generators are better suited to decorative imagery than to information you need to be right.
How do I keep my infographics compliant with Australian health advertising rules?
Keep them educational and observational: describe what a modality involves or how the body works, rather than promising outcomes or making treatment claims. Use your own carefully worded content, tell Claude to keep your wording exactly as written, and review the final visual against the TGA advertising guidelines for your modality.
Can I use my existing brand colours and logo?
Yes, and you should. Take screenshots of your website and logo and upload them as your reference images. Claude will extract your colours and fonts so every infographic matches the brand your clients already recognise.
How do I turn the finished infographic into an image I can post?
Open the preview in Claude, then take a screenshot or use the download option. Crop to size and upload it to Instagram or Facebook like any other image, or export it to PDF for printing.
What if the first version looks wrong?
Completely normal, and easily fixed. Tell Claude what feels off in ordinary language: too busy, too corporate, colours too loud. Each round of changes takes seconds, and most practitioners land on a style they love within a few tries.
Your next step
Book fifteen minutes this week, gather three images you love, and make your first infographic with the two prompts above. Then come and show us.
THRIVING PRACTITIONERS GROWTH HUB
Twice a month Friday Q&A sessions, a full replay library, step-by-step Action Plans, interactive client education resources for your website, and a WhatsApp group where practitioners share what they are building. $49 per month; first month free, cancel anytime.
PATHWAY TO PRACTICE VISIBILITY
Our flagship on-demand course for natural health practitioners: five weeks of practical, step-by-step training on becoming visible in the age of AI search, from your digital foundations to content that AI systems cite. Founding price $399 through winter, rising to $499 on 1 September 2026.
https://thrivingpractitioners.com/pathway-to-practice-visibility/
I would love to see what you create. Every practitioner I meet has knowledge worth sharing; the visuals are just how we help it travel.
James
Founder, Thriving Practitioners. Former naturopath, clinic owner and creator of Metaphysical SEO.